Quantifying protein-protein binding
By Daniel Some, Principal Scientist, Wyatt Technology Corporation
Friday, 30 November, 2012
Composition-gradient static light scattering can be used to determine the binding affinity and stoichiometry of reversible protein complexes, without tagging, immobilisation or other modifications. The method can distinguish and quantify multiple simultaneous stoichiometries.
The quantitative characterisation of reversible protein-protein interactions is fundamental to the elucidation of basic biological function as well as the development of new biotherapeutics. Composition gradient multiangle light scattering (CG-MALS) employs static light scattering (SLS) technology to determine stoichiometry and equilibrium association constants of self- and hetero-associations. This is accomplished without recourse to sample modifications such as fluorescent tagging or surface immobilisation, and with no restrictions on buffer composition - the experiment may be carried out in native solution or the desired formulation buffer.
The CG-MALS technique
The key to understanding how CG-MALS operates lies in the basic premise of SLS: the intensity of light scattered from macromolecules in solution is proportional to the product of the concentration c and the weight-averaged molar mass Mw. As protein complexes form, Mw increases; for example, were all the molecules present to dimerise, the scattered intensity would double. In a reversible association, the ratio of protein complexes to protein monomers reaches an equilibrium value that depends on the total concentration of each species. By analysing the SLS measurements acquired over a series of compositions it is possible to determine which complexes are being formed and to quantify their respective binding affinities as equilibrium dissociation constants KD. With current instrumentation, CG-MALS accesses protein dissociation constants in the range of 100 picomolars to millimolars. One of the key advantages of CG-MALS is its potential for establishing absolute stoichiometry - eg, distinguishing between 1:1 and 2:2 complexes - even when self- and hetero-association occur simultaneously.
Automation
A CG-MALS procedure consists of:
- preparing solutions of each of the required compositions;
- delivering each to an SLS instrument and concentration detector;
- recording the scattered intensity and concentration values;
- performing a nonlinear least-squares fit of the data to each of the association models to be tested against the experimental data.
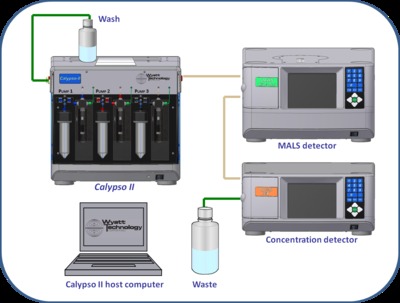
For rich interactions, 10 or even 20 individual compositions may be needed to clearly discriminate between models and obtain a reliable set of association constants. Manual preparation and measurement procedures would clearly be tedious, time consuming and prone to operator error. A computer-controlled apparatus such as Wyatt Technology’s Calypso system overcomes the difficulties of manual CG-MALS by automating the entire procedure, integrating sample prep and delivery with data acquisition, analysis and model fitting in one comprehensive package. The Calypso works in conjunction with a MALS detector and an online concentration detector or UV absorption detector to provide a complete CG-MALS set-up, shown in Figure 1.

AB complex characterisation
In the first heteroassociation example, we examine a well-characterised enzyme/inhibitor system that forms 1:1 complexes: α-chymotrypsin (CHTR) and bovine pancreatic trypsin inhibitor (BPTI) in phosphate buffered saline at neutral pH. CHTR and BPTI were dissolved at nominal concentrations of 0.5 and 0.2 mg/mL, respectively, then dialysed against the buffer by means of a Sephadex desalting column.
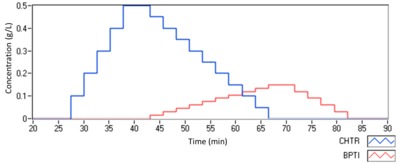
The CG-MALS method consists of a buffer flush to obtain initial baseline values, then a single-component ascending concentration series of CHTR, followed by a crossover composition series of CHTR and BPTI varying from 100% CHTR and 0% BPTI to 0% CHTR and 100% BPTI, a descending concentration series of BPTI, and finally a buffer flush for final baseline. The single-component stepwise gradients serve to characterise the monomer and any self-association that may be present, while the crossover gradient probes the entire range of possible heteroassociation stoichiometries. The timeline graph, reproduced in Figure 2, visualises the method design.

The Calypso II hardware accessory features three computer-controlled syringe pumps. Once the two sample vials and buffer reservoirs are installed, the software automates sample preparation and delivery by combining the output pump streams on the fly in a static mixer as they are injected into the detector flow cells. Different compositions are obtained by varying the relative flow rates of the pumps. After metering out the predefined volume, flow stops and data may be integrated over any time scale. This stop-flow measurement provides for observing the kinetics of any reactions that may be occurring. Data acquisition is automatically synchronised to begin and end with the method. The duration of the measurement is typically 0.5 to 2 hours.
Figure 3 depicts the SLS (coloured) and concentration (black) data after pre-processing, which includes baseline subtraction, applying calibration constants and normalisation corrections. Each plateau corresponds to the signal from a particular sample composition. The vertical grey bars denote the fully equilibrated region of each plateau selected for the modelling analysis.

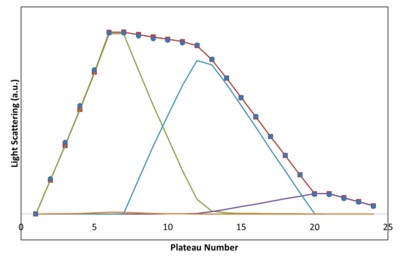
Finally data modelling is carried out. Figure 4 shows the results of fitting the SLS and concentration plateau data to a simple AB association together with homo-dimerisation of each protein. The blue circles correspond to the measured SLS values, while the red squares and line correspond to the fit. The other plots illustrate the SLS signal contributed by each of the components: unbound monomer of A (CHTR), unbound monomer of B (BPTI), the AB complex, AA and BB dimers. The AB signal peaks when the injected sample comprises the stoichiometric ratio of the complex. This is a general feature of CG-MALS which helps distinguish different stoichiometries.

The dissociation constant resulting from this fit is KD = 90 nM. This value falls within the range determined elsewhere and by other techniques, of 25-200 nM. Under these conditions, chymotrypsin undergoes very weak self-association, barely visible in the fit. Adding other terms to the fitted model, eg, self-association or AAB complexes, does not change the results as the additional complexes end up with negligible affinities in the best-fit result. The entire fitting procedure requires only a few seconds on a moderately fast PC.
Characterisation of multivalent proteins
The second example demonstrates characterisation of a bivalent interaction. When chymotrypsin associates with soybean trypsin inhibitor (STI), STI presents two equivalent binding sites to the enzyme, so that both AB and AAB complexes are present. Here the crossover gradient is divided into finer steps in order to better resolve the two complexes.
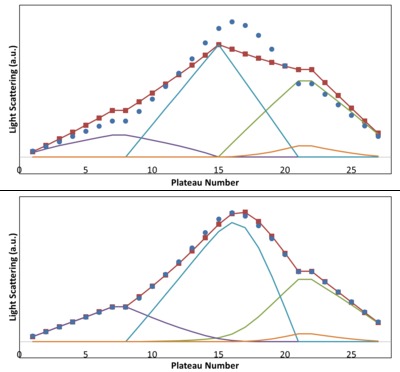
The buffer conditions and CHTR preparation were the same as in the previous measurement, while STI was prepared at 0.2 mg/mL and similarly dialysed. The modelling results are shown in Figure 5: in the upper graph, an ill-fated attempt to fit the data to a model that allows for three independent parameters: affinities of the AB, AA and BB complexes; in the lower graph, the fit to a model that provides for AAB complexes as well, under the assumption of two equivalent binding sites (only one independent parameter, the single binding site affinity). Clearly the latter produces an excellent fit (KD = 0.54 µM, comparing well with the literature values of 0.3 to 1.2 µM under similar buffer conditions), validating the stoichiometry model. Weak homo-dimerisation of chymotrypsin is evident and fitted to a KD = 330 µM, in line with known values at this pH. The Calypso software provides plots of the concentrations of each species at each composition step as well as the SLS signals.

These two examples illustrate some common heteroassociations, analysed with relatively simple modelling. More complicated systems that have been addressed include simultaneous self- and heteroassociation, multiple degrees of self-association, multivalent-multivalent systems (both binding partners are multivalent) and incompetent protein fractions (some portion of the monomers are misfolded or aggregated). The Calypso software provides for a large variety of association models as well as simulating experiments in the design stage.
Summary
Biomolecular interactions can be complex and require multiple complementary and orthogonal techniques in order to obtain a full picture. CG-MALS technology fills in many of the gaps, addressing all types of biomacromolecules including proteins, peptides, aptamers and more. With minimal method development and rapid, rigorous, fully quantitative analysis, CG-MALS is an essential biophysical technique.
Droplet microfluidics for single-cell analysis
Discover how droplet microfluidics is revolutionising single-cell analysis and selection in...
PCR alternative offers diagnostic testing in a handheld device
Researchers have developed a diagnostic platform that uses similar techniques to PCR, but within...
Urine test enables non-invasive bladder cancer detection
Researchers have developed a streamlined and simplified DNA-based urine test to improve early...


